About D3.js
개요
- https://d3js.org
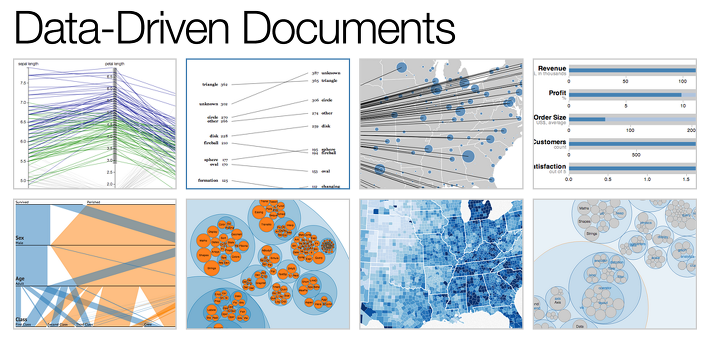
- https://github.com/mbostock/d3/wiki/Gallery
- D3.js is a JavaScript library for manipulating documents based on data. D3 helps you bring data to life using HTML, SVG, and CSS. D3’s emphasis on web standards gives you the full capabilities of modern browsers without tying yourself to a proprietary framework, combining powerful visualization components and a data-driven approach to DOM manipulation.
D3 Workshop
- Visualizing Data with Web Standards (HTML, SVG, CSS, javascript, CSV, JSON). D3 provides transformation, no representation.
- Visualization requires visual encoding: mapping data to elements.
- The name “D3” refers to the W3C Document Object Model.
Tutorials
vegibit에 올라온 turorial을 따라해 보았다. index.html은 아래와 같다.
<!DOCTYPE html>
<html>
<head>
<meta charset="utf-8">
<title>D3.js</title>
</head>
<div class="someclass">
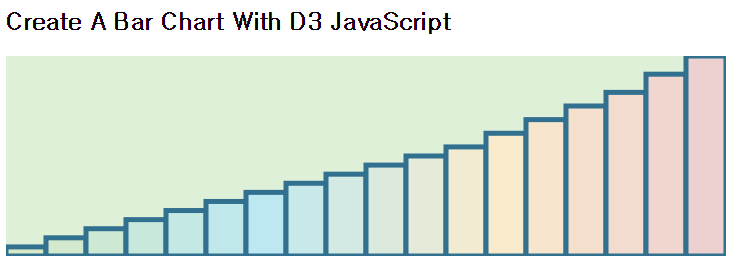
<h2>Create A Bar Chart With D3 JavaScript</h2>
<div id="bar-chart">
</div>
</div>
<body>
<script src="d3.min.js" charset="utf-8"></script>
<script src="test.js"></script>
</body>
</html>test.js는 아래와 같다.
var chartdata = [10, 20, 30, 40, 50, 60, 70, 80, 90, 100, 110, 120, 135, 150, 165, 180, 200, 220];
var height = 200, width = 720, barWidth = 40, barOffset = 20;

var yScale = d3.scale.linear()
	.domain([0, d3.max(chartdata)])
	.range([0, height])

var xScale = d3.scale.ordinal()
	.domain(d3.range(0, chartdata.length))
	.rangeBands([0, width])

var colors = d3.scale.linear()
	.domain([0, chartdata.length*.33, chartdata.length*.66, chartdata.length])
	.range(['#d6e9c6', '#bce8f1', '#faebcc', '#ebccd1'])

d3.select('#bar-chart').append('svg')
	.attr('width', width)
	.attr('height', height)
	.style('background', '#dff0d8')
	.selectAll('rect').data(chartdata)
	.enter().append('rect')
	.style({'fill': function(data,i){return colors(i);}, 'stroke': '#31708f', 'stroke-width': '5'})
	.attr('width', xScale.rangeBand())
	.attr('height', function (data) {
		return yScale(data);
	})
	.attr('x', function (data, i) {
		return xScale(i);
	})
	.attr('y', function (data) {
		return height - yScale(data);
	});
결과는 아래와 같다.